
Environment
Carbon Majors: 57 fossil fuel, cement producers linked to 80% of GHG emissions since 2016
Top 5 investor-owned companies, Chevron, ExxonMobil, BP, Shell, and ConocoPhillips, are responsible for 11.1% of historical fossil fuel and cement CO2 emissions (196 GtCO2).

Some 57 corporate and state entities can be linked to 80% of fossil fuel and cement CO2 emissions since the 2016 Paris Agreement, according to a new report by InfluenceMap using the Carbon Majors database on Thursday (4 April).
The new report quantifies the contribution of the world’s largest oil, gas, coal, and cement producers to global carbon emissions, which are the primary driver of climate change.
The report shows that the majority of global CO2 emissions produced since the Paris Agreement can be traced to a small group of high emitters who are failing to slow production.
The 57 corporate and state entities can be linked to 80% of fossil fuel and cement CO2 emissions from 2016 through 2022. Nation-state producers account for 38% of emissions in the database since the Paris Agreement, while state-owned entities account for 37%, and investor-owned companies for 25%.
The Carbon Majors dataset contained emissions data from 1854 through 2022. New analysis of the whole dataset revealed that over 70% of global fossil fuel and cement CO2 emissions since the Industrial Revolution can be traced to 78 corporate and state producing entities. Over the same period, just 19 entities contributed 50% of these CO2 emissions.

Carbon Majors holds global significance as the first and only provider of this comprehensive view of corporate fossil fuel producers’ contributions to greenhouse gas emissions.
Other key findings from this new analysis include:
- The top 5 investor-owned companies, Chevron, ExxonMobil, BP, Shell, and ConocoPhillips, are responsible for 11.1% of historical fossil fuel and cement CO2 emissions (196 GtCO2).
- The top 5 state-owned companies, Saudi Aramco, Gazprom, the National Iranian Oil Company, Coal India, and Pemex, are responsible for 10.9% of historical fossil fuel and cement CO2 emissions (194 GtCO2).
- Coal supply since 2015 has shifted from investor-owned to state-owned entities. Investor-owned coal production emissions dropped by 939 MtCO2e, a decrease of 27.9%, from 2015 to 2022. However, emissions from nation-state and state-owned producers grew by 2,208 MtCO2e and 343 MtCO2e between 2015 and 2022, increases of 19% and 29%, respectively.
- The majority of fossil fuel companies totaled higher production in the seven years after the Paris Agreement compared to the seven-year period before. 65% of state-owned companies and 55% of investor-owned companies showed higher production in 2016–2022 than in 2009–2015.
- The increase in production by state- and investor-owned companies after the Paris Agreement compared to before is most prevalent in Asia. All 5 Asian investor-owned companies and 8 out of the 10 Asian state-owned entities are linked to higher emissions in 2016–2022 compared to 2009–2015. This is primarily shaped by rising emissions from Asian coal production.
Daan Van Acker, Program Manager at InfluenceMap, said: “The Carbon Majors database is a key tool in attributing responsibility for climate change to the fossil fuel producers with the most significant role in driving global CO2 emissions. InfluenceMap’s new analysis shows that this group is not slowing down production, with most entities increasing production after the Paris Agreement. This research provides a crucial link in holding these energy giants to account on the consequences of their activities.”
Carroll Muffett, President and CEO of the Center for International Environmental Law (CIEL), said: “Richard Heede’s landmark Carbon Majors research transformed the landscape of climate accountability by using the fossil fuel industry’s own reported production and operation figures to calculate and expose the true scale of its role in the climate crisis.”
“By updating and extending that research—and making it more widely accessible and usable for researchers, decisionmakers, and litigators alike—InfluenceMap’s new Carbon Majors database will transform that landscape yet again.”
“The Carbon Majors database makes it dramatically easier to document, calculate, and visually demonstrate the growing chasm between the urgent demands of climate reality and the continued reckless and intentional growth of oil and gas production.”
“Critically, it enables us to track changes in corporate behavior and production across discrete and clearly defined timescales that will be relevant to investors, investigators, and litigators alike. It is a vital and powerful new tool in the work toward climate action and climate accountability.”
According to InfluenceMap, the Carbon Majors dataset has proved crucial in holding fossil fuel producers to account for their climate-related impacts in academic, regulatory, and legal contexts.
Examples include quantifying the contribution these entities have made to global surface temperature, sea level, and atmospheric CO2 rise; and establishing corporate accountability for climate related human rights violations in the Commission on Human Rights of the Philippines’ 2022 National Inquiry on Climate Change.
Note: The full report of The Carbon Majors Database: Launch Report can be viewed here.
Photo credit: Patrick Hendry on Unsplash
Published: 5 April 2024
Methanol
GENA Solutions: Total renewable and low-carbon methanol project pipeline increases from 61.8 to 62.2 Mt by 2032
Information shared by MI – the Global Methanol Alliance meant to assist the maritime industry in the adoption of methanol as a mainstream marine fuel heading into IMO 2030/2050.
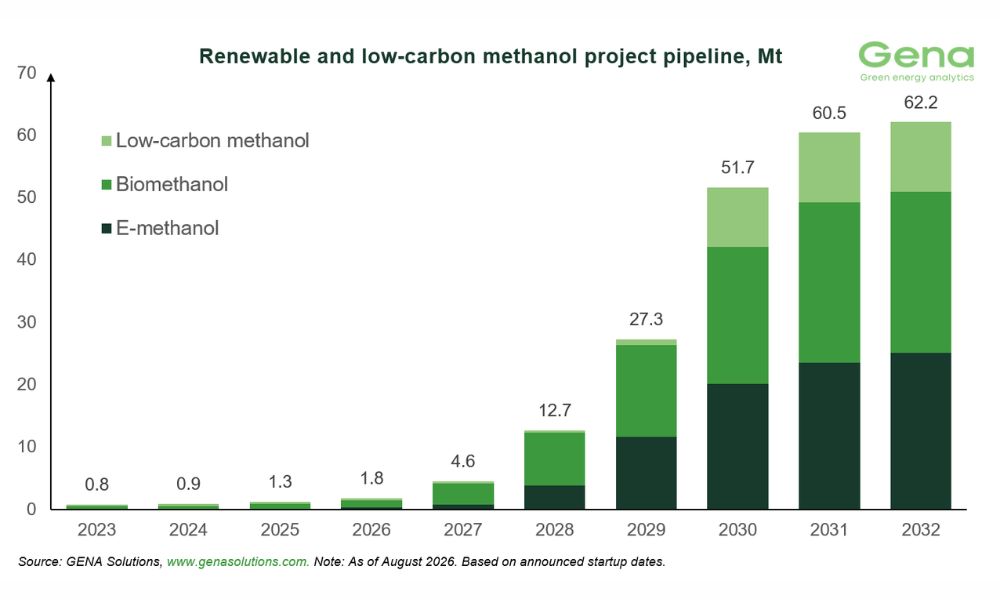
MI – the Global Methanol Alliance recently shared with Manifold Times the renewable and low-carbon methanol project pipeline August 2026 release produced by GENA Solutions Oy.
Information from the release is meant to provide the bunkering publication’s readers with insight on renewable methanol availability, and to assist the maritime industry in the adoption of methanol as a mainstream marine fuel heading into IMO 2030/2050.
Key takeaways from GENA’s August 2026 Methanol release are as follows:
- As of the end of August 2026, GENA tracks 286 renewable and low carbon methanol projects, representing 62.2 Mt of capacity by 2032. This includes 25.1 Mt of e-methanol, 25.9 Mt of biomethanol, and 11.2 Mt of low carbon methanol capacity.
- Two new projects were added to Project Navigator last month, while one frozen project was excluded. The project pipeline increased by 0.4 Mt month on month.
- Four new offtake agreements were registered during August, including two biomethanol and two e-methanol agreements.
- About 8% of the cumulative renewable methanol project pipeline capacity has reached FID so far, with another 11% at the FEED stage.
- Considering the current uncertainty around regulatory developments and demand growth, GENA projects that renewable methanol capacity could reach 6 Mt to 12 Mt by 2031.
Note: The full article can be viewed here.
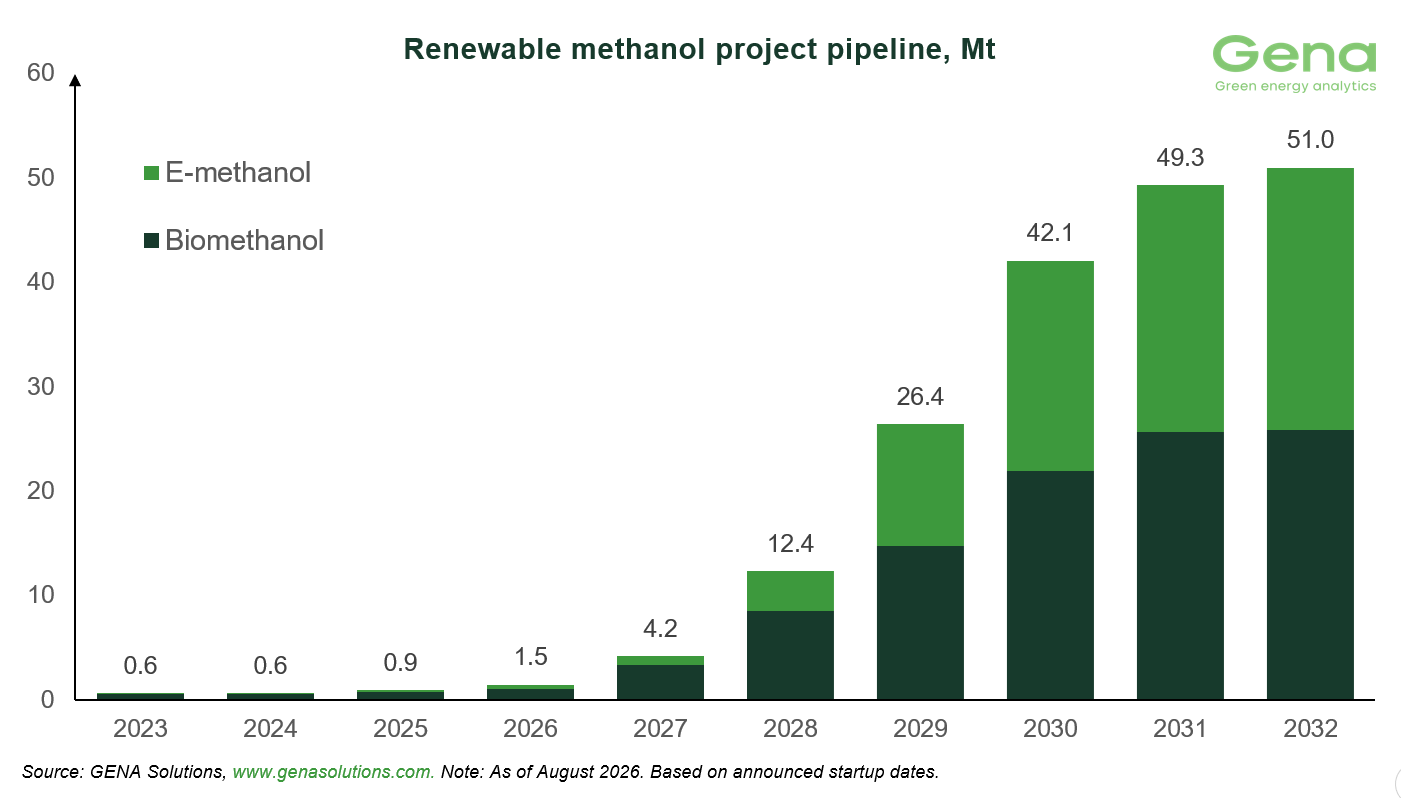
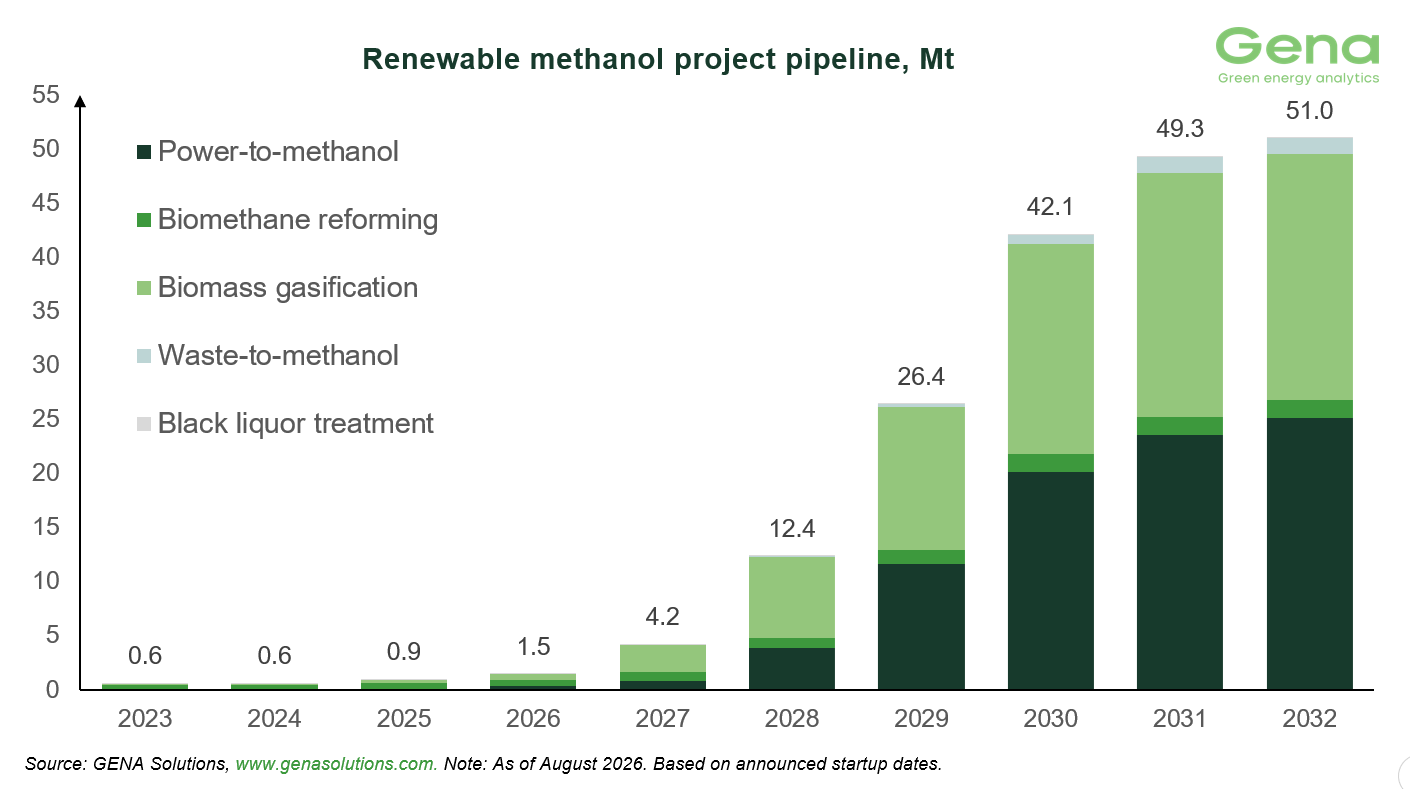
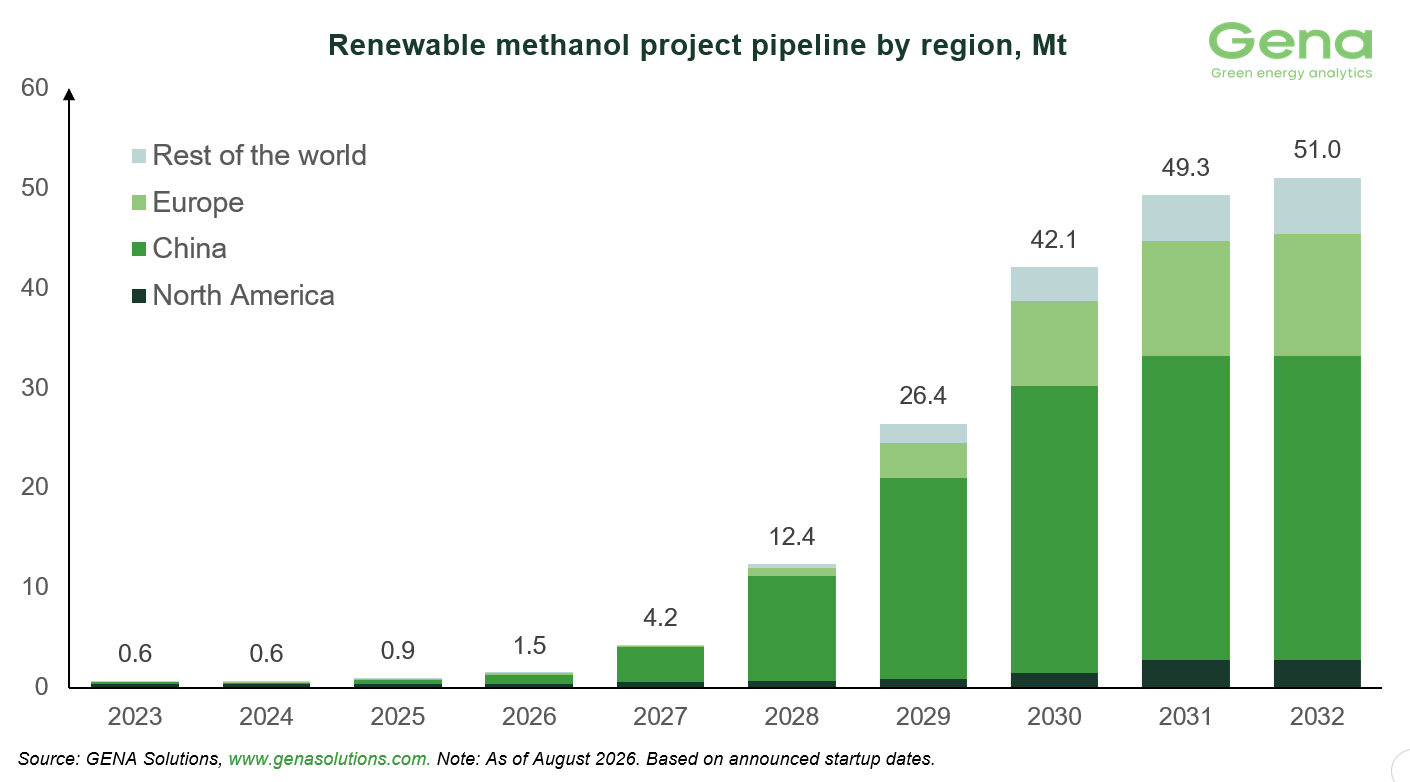
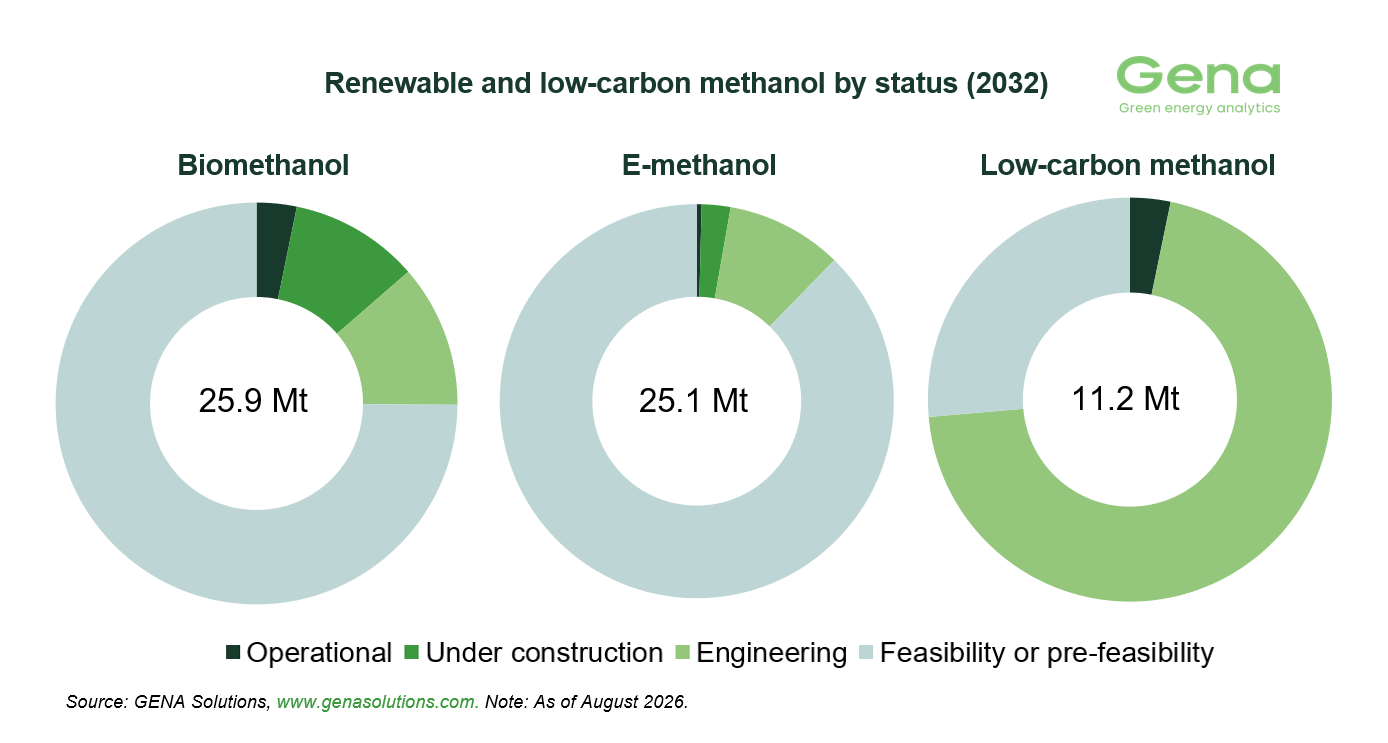
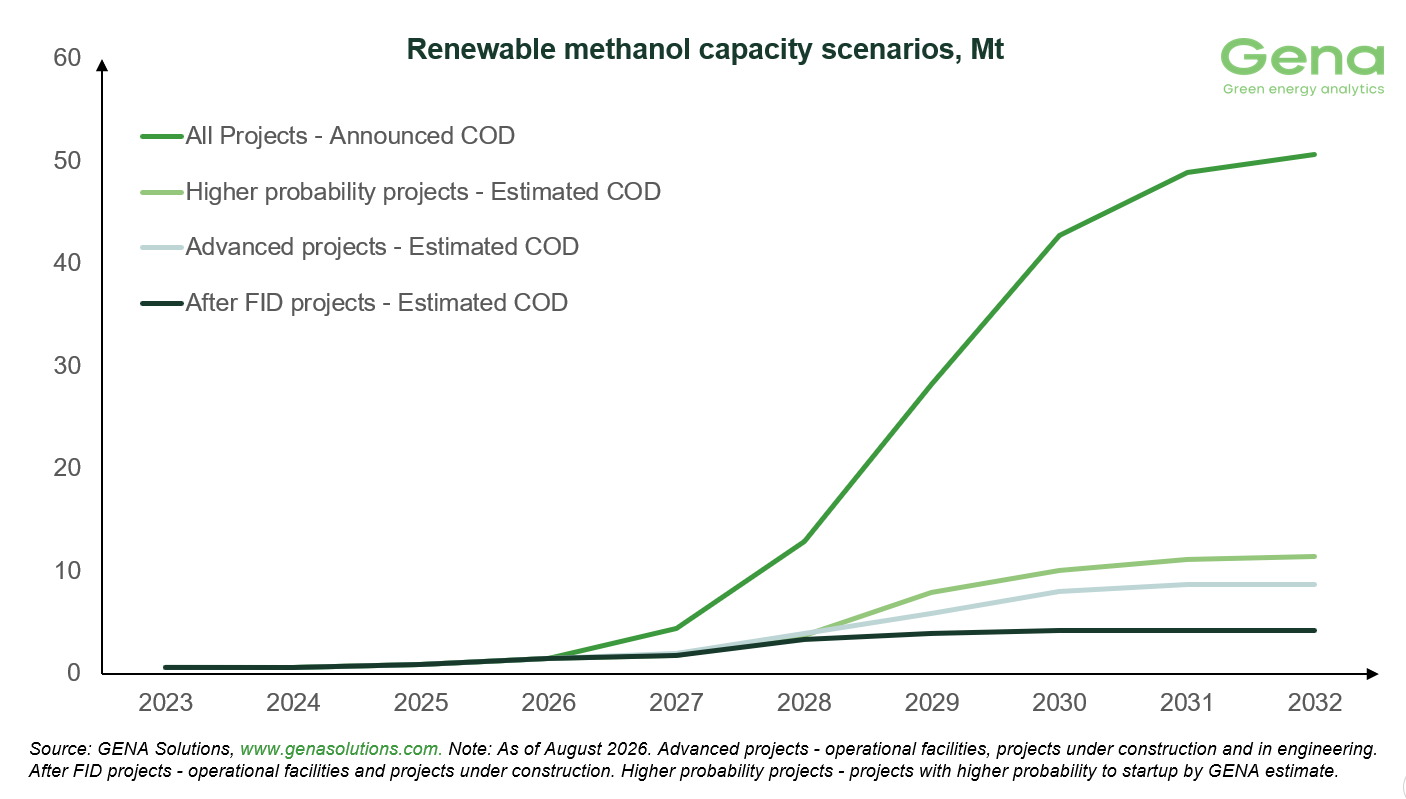
Photo credit: GENA Solutions
Published: 4 September, 2026
Business
Singapore: MPA urges maritime firms to prepare for potential haze with plan
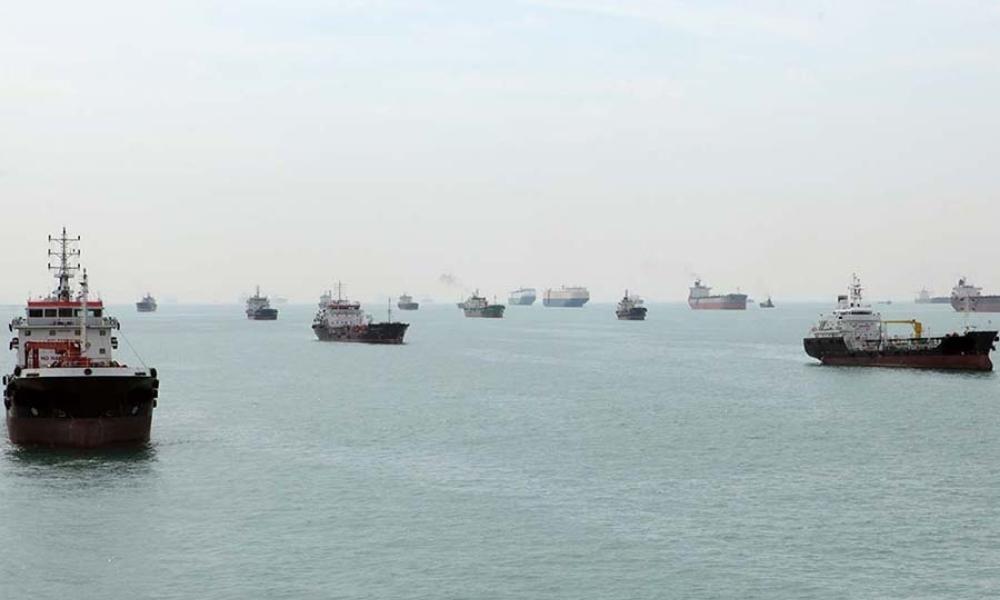
MPA encourages all maritime companies, especially those with workers performing outdoor work to maintain a business continuity plan for haze.
Alternative Fuels
DNV report: Regulatory uncertainty demands fleet strategies built for multiple futures
Report examines four regulatory scenarios, ranging from adoption of IMO NZF in its current form to its outright rejection, energy efficiency uptake, and long-term bunker fuel and technology strategies.

OUR INDUSTRY PARTNERS

Singapore: Liquidators of Nan Ho Maritime, Nan Xin Maritime issue notices of dividend

Singapore-based EPS takes delivery of three LNG dual-fuel bulk carriers

ISWG-GHG 22: IMO working group aims to present NZF text at MEPC 85

UCL on ISWG-GHG 22: Majority back GHG pricing, centralised fund in IMO NZF talks

LR awards AiP to CSSC Huangpu Wenchong for 12,500 m³ LNG bunker vessel design

DNV at SMM: Chinese shipbuilders, European owners seek closer ties on alternative bunker fuels

Auramarine: Marine fuel flexibility will be key to shipping’s energy transition

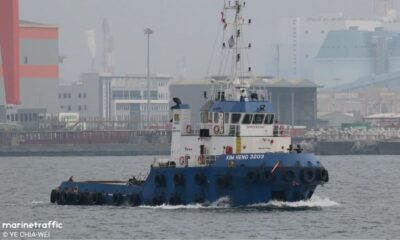
Singapore-flagged tugboat “Kim Heng 3203” placed under Sheriff’s arrest

US targets five bunker companies in latest sanctions campaign against Iran

China’s bunker market reshaped by tax rebates, trade flows and refining changes, says economist

Rajah & Tann: Bunker disputes are won in the first 48 hours

Hengli Petrochemical’s ex-Singapore trading arm faces winding up application

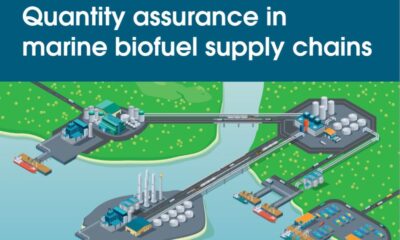
Report: GCMD outlines practical approach to quantity assurance in marine biofuel supply chains

Singapore: Notices of annual meeting issued for Vroon Shipping Asia and related firms
-
 Vessel Arrest2 weeks ago
Singapore-flagged tugboat “Kim Heng 3203” placed under Sheriff’s arrest
-
 Sanctions2 weeks ago
US targets five bunker companies in latest sanctions campaign against Iran
-
 Interview2 weeks ago
China’s bunker market reshaped by tax rebates, trade flows and refining changes, says economist
-
 Bunker Claim6 days ago
Rajah & Tann: Bunker disputes are won in the first 48 hours
-
 Winding up2 weeks ago
Hengli Petrochemical’s ex-Singapore trading arm faces winding up application
-
 Biofuel2 weeks ago
Report: GCMD outlines practical approach to quantity assurance in marine biofuel supply chains
-
 Winding up2 weeks ago
Singapore: Notices of annual meeting issued for Vroon Shipping Asia and related firms
-
 Alternative Fuels2 weeks ago
GEA to provide global ethanol fuel data for DNV’s AFI platform