Connect with us

Environment

What is it about speed that upsets the shipping industry?

The Deputy Secretary General at BIMCO explains why imposing speed limits it is not the answer to cut emissions.

Admin

Published

on

5d30f3054f356 1563489029

The following article entitled ‘What is it about speed that upsets the shipping industry?’ written by Lars Robert Pedersen, Deputy Secretary General at BIMCO, first appeared in the June edition of the BIMCO Bulletin here.

You won’t find many – if any – who disagree that the higher the speed of a ship, the higher the level of greenhouse gas emissions. So why would I argue that, while imposing speed limits may have a popular ring to it, it is not the answer as the industry seeks to cut emissions? After all, our mission is to do exactly that: cut emissions.

The important question is not whether a speed limit should be introduced to cut emissions, but how it would be checked. Before vouching for an argument, one must look at whether it can be done.

What looks good on paper does not always work in practice. Enforceability is a very important aspect of any meaningful regulation. Can authorities check for compliance? Is the regulation meaningful if it can’t be checked?

Only one option would work in practice

I can think of four possible options, but only one works when it comes to implementing a solution that can be measured and checked accurately, and that correlates to emissions:

  • A limit for speed through water. This cannot be checked accurately, but correlates closely to emissions.
  • A limit for speed over ground. This can be checked accurately, but there is a much lower correlation to emissions.
  • A limit for average speed (over ground or through water). It may be possible to check this, but there is also a much lower correlation to emissions.
  • Limits for propulsion power. This is the only option that can be checked accurately and has a close correlation to emissions. 

To understand why this last option is the best solution, we must get technical.

Most people have an intuitive understanding of what speed means, and that is usually derived from personal observations when we move on the ground. If you move 7km in one hour, your average speed is 7km per hour. Short and simple.

What is less simple is recognising that, when we move on the ground, there is no slip. The wheels on our car turn one revolution, and the car has moved exactly the distance equal to the circumference of the wheel.

It is different at sea – and, for that matter, when we talk about movement in the air.

Measuring a ship’s speed through water is not accurate

When a ship moves, it moves through water. It also moves over ground – and so does the water in which the ship sails. Observing a ship’s speed over ground is really an observation of the ship’s speed through water plus or minus the current at any given time.

The problem is, we do not know the current at any given time, and measuring a ship’s speed through water directly is not very accurate, either.

When a ship is new, and the shipyard measures its speed/power curve, it does so by conducting a very precisely measured double run between two fixed positions: there and back. This eliminates the influence of current and results in an average speed over ground that accurately reflects the ship’s speed through water.

When a ship is in operation, it is impractical to measure in this way. The shipping company still wants to keep an eye on the ship’s performance, and this is often done by observing propeller revolutions and factoring in an average slip percentage for the ship. Slip is the relationship between the observed movement of the ship when the propeller turns one revolution in water and the propeller’s theoretical movement of the ship had the water been a solid material.

Some ships have doppler speed logs, which use advanced techniques to measure the speed of the water column below the ship relative to the ship itself. Still, the water flow is not laminar close to the ship hull and such devices need frequent adjustment to produce accurate results.

In summary, measuring a ship’s speed through water is not a precise exercise.

Low correlation between emissions and speed over ground

If you measure a ship’s speed over ground and try to correlate this to the emissions or the power of the engine, you would get a very large scatter. This is because the current changes by time and location – and it changes significantly. The difference between favourable currents with a ship and unfavourable currents against a ship may be as large as 50% of the speed observed over ground.

So there is a low correlation between a ship’s emissions and its speed over ground.

Cutting average speed – where is the emissions connection?

When we look at average speed – the third option, above – we need to bear in mind how speed through water and power correlates for a ship to understand if this could work. Remember the rule of thumb: power = constant x speed3.

A ship travelling between two locations, sailing at constant speed, emits 100% CO2. A ship travelling between the same two locations – sailing the first half distance at 50% higher than the average speed, and the second half distance at half of that higher speed – would emit 141% CO2. These two scenarios give the same average speed for the ship.

So there is no correlation between average speed through water and emissions. Averaging speed over ground just make things even more arbitrary.

Emissions are driven by power of the engine

All this may seem unimportant, but emissions are driven by the power of the engine that turns the ship’s propeller. There is very good correlation between emissions and power of the engine.

There is also a reasonably good correlation between a ship’s emissions and its speed through water, as mentioned in the first option. We must keep in mind, however, that two ships with the same cargo-carrying capacity – but different efficiency – would have different emissions. So the correlation between many ships travelling at the same speed and their emissions is not good.

We can continue to talk about speed limits for ships, but if we forget to ask ourselves the fundamental question of whether it helps cut emissions, we are heading in the wrong direction on our way to the industry’s 2050 greenhouse gas emission targets.

Limiting emissions via a ship’s power to the propeller not only gets us in the right direction, it encourages innovation around more efficient ships – and helps us assure a level competitive playing field on our way there.

Published: 19 July, 2019
 

Continue Reading

Methanol

GENA Solutions: Total renewable and low-carbon methanol project pipeline increases from 61.8 to 62.2 Mt by 2032

Information shared by MI – the Global Methanol Alliance meant to assist the maritime industry in the adoption of methanol as a mainstream marine fuel heading into IMO 2030/2050.
Admin

Published

on

By

28 1

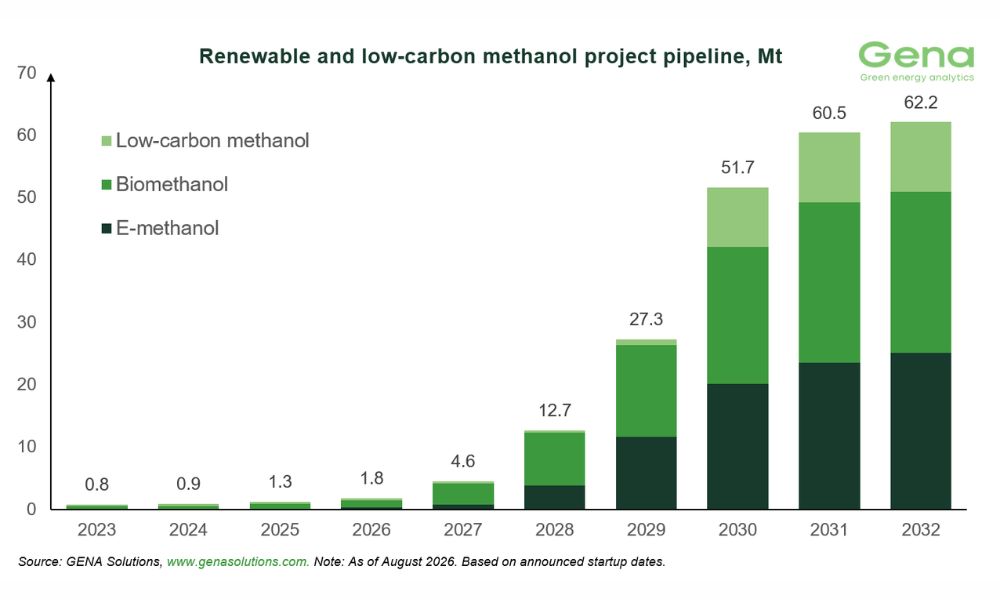
MI – the Global Methanol Alliance recently shared with Manifold Times the renewable and low-carbon methanol project pipeline August 2026 release produced by GENA Solutions Oy.

Information from the release is meant to provide the bunkering publication’s readers with insight on renewable methanol availability, and to assist the maritime industry in the adoption of methanol as a mainstream marine fuel heading into IMO 2030/2050.

Key takeaways from GENA’s August 2026 Methanol release are as follows:

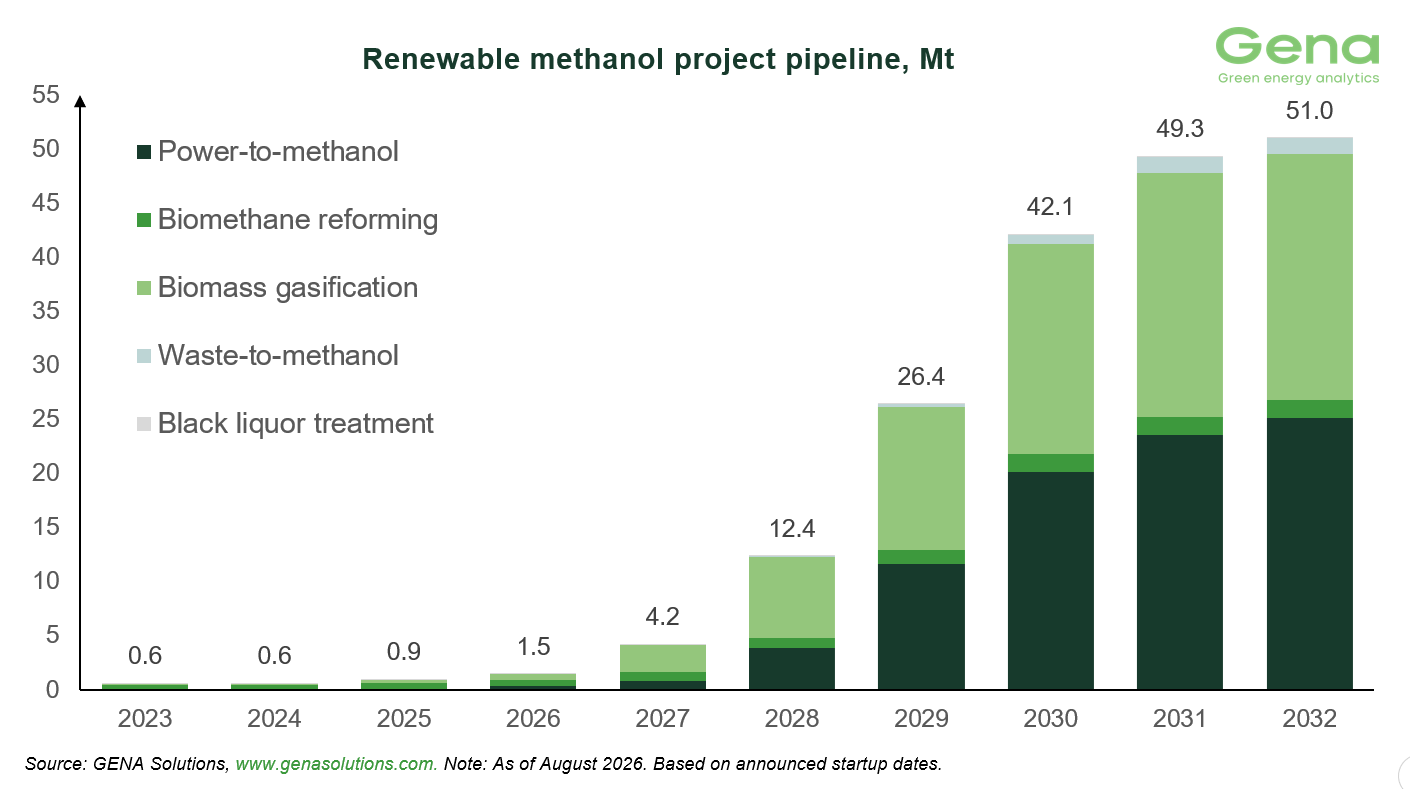
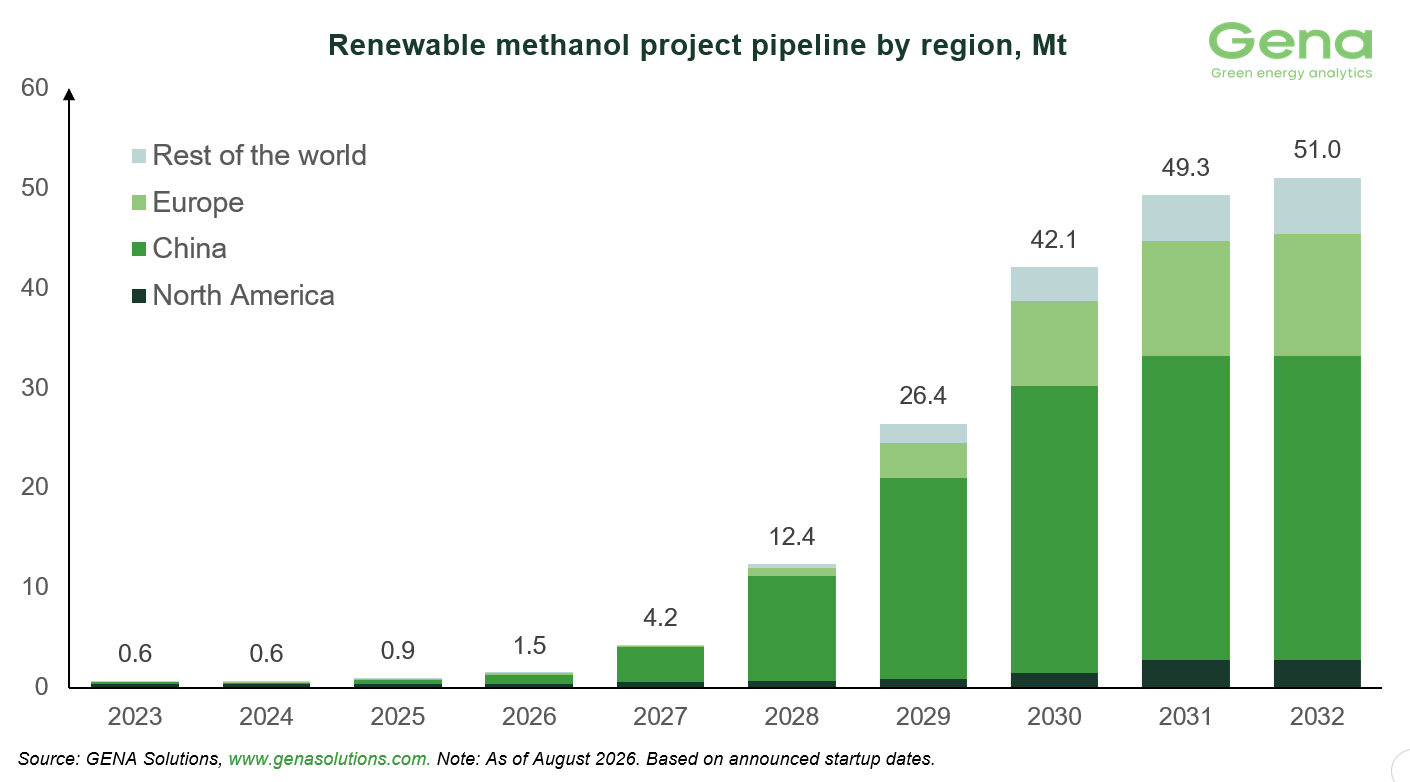
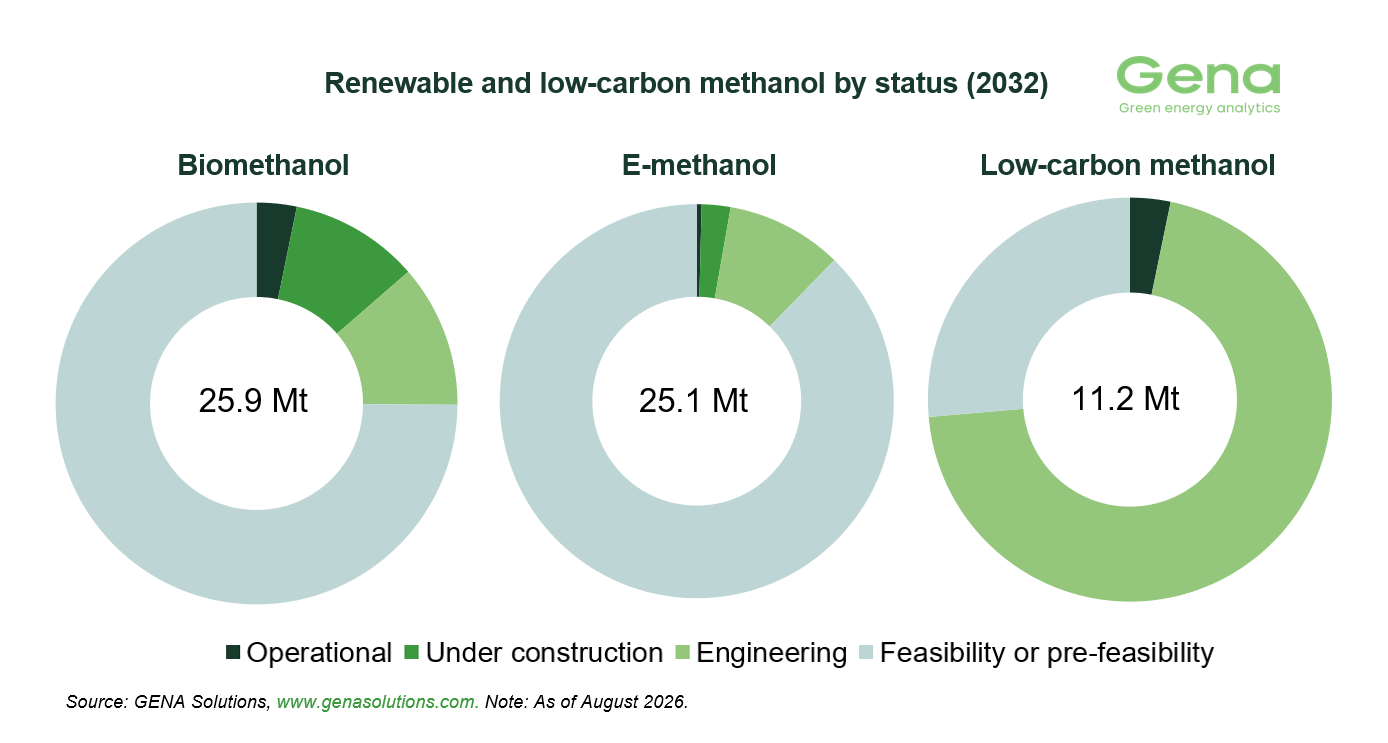
  • As of the end of August 2026, GENA tracks 286 renewable and low carbon methanol projects, representing 62.2 Mt of capacity by 2032. This includes 25.1 Mt of e-methanol, 25.9 Mt of biomethanol, and 11.2 Mt of low carbon methanol capacity.
  • Two new projects were added to Project Navigator last month, while one frozen project was excluded. The project pipeline increased by 0.4 Mt month on month.
  • Four new offtake agreements were registered during August, including two biomethanol and two e-methanol agreements.
  • About 8% of the cumulative renewable methanol project pipeline capacity has reached FID so far, with another 11% at the FEED stage.
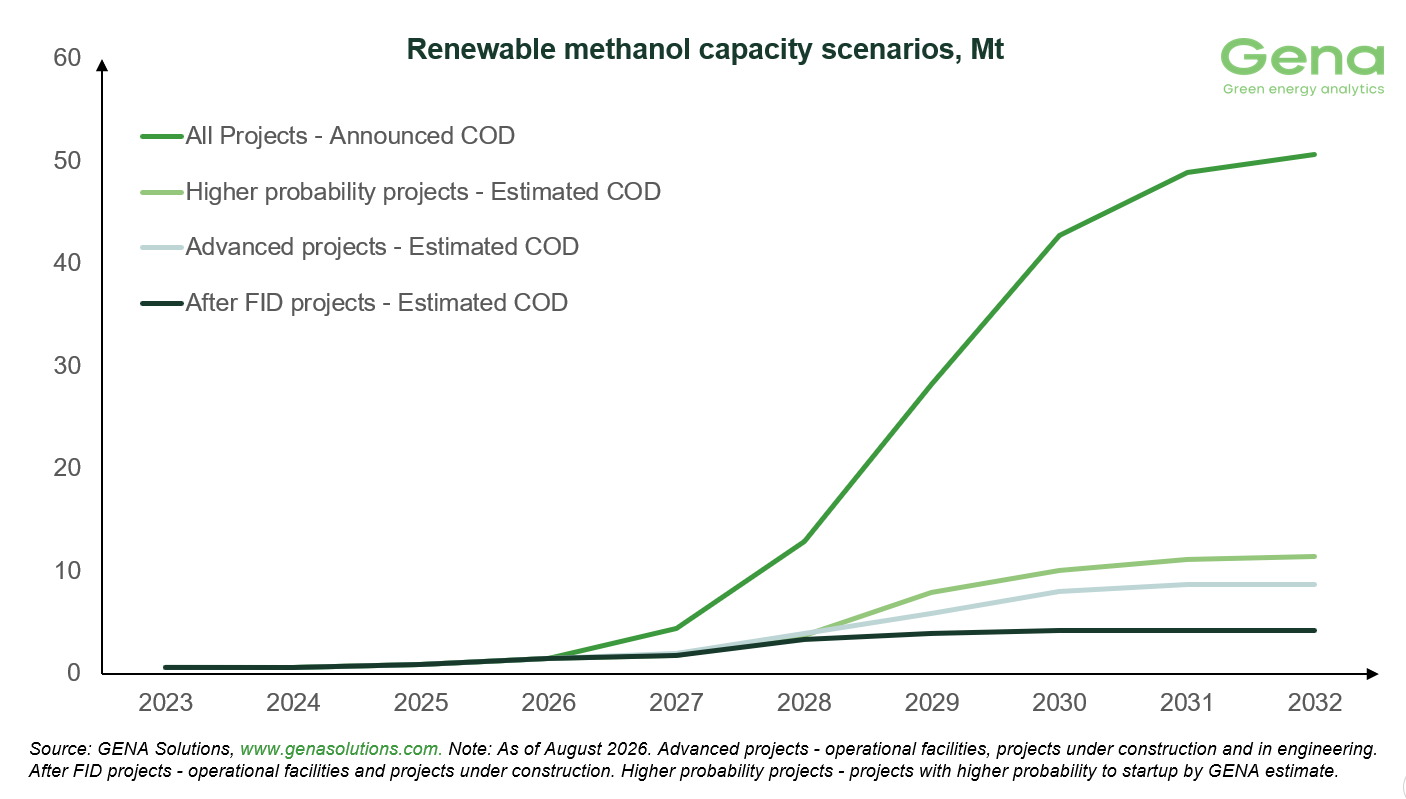
  • Considering the current uncertainty around regulatory developments and demand growth, GENA projects that renewable methanol capacity could reach 6 Mt to 12 Mt by 2031.

Note: The full article can be viewed here.
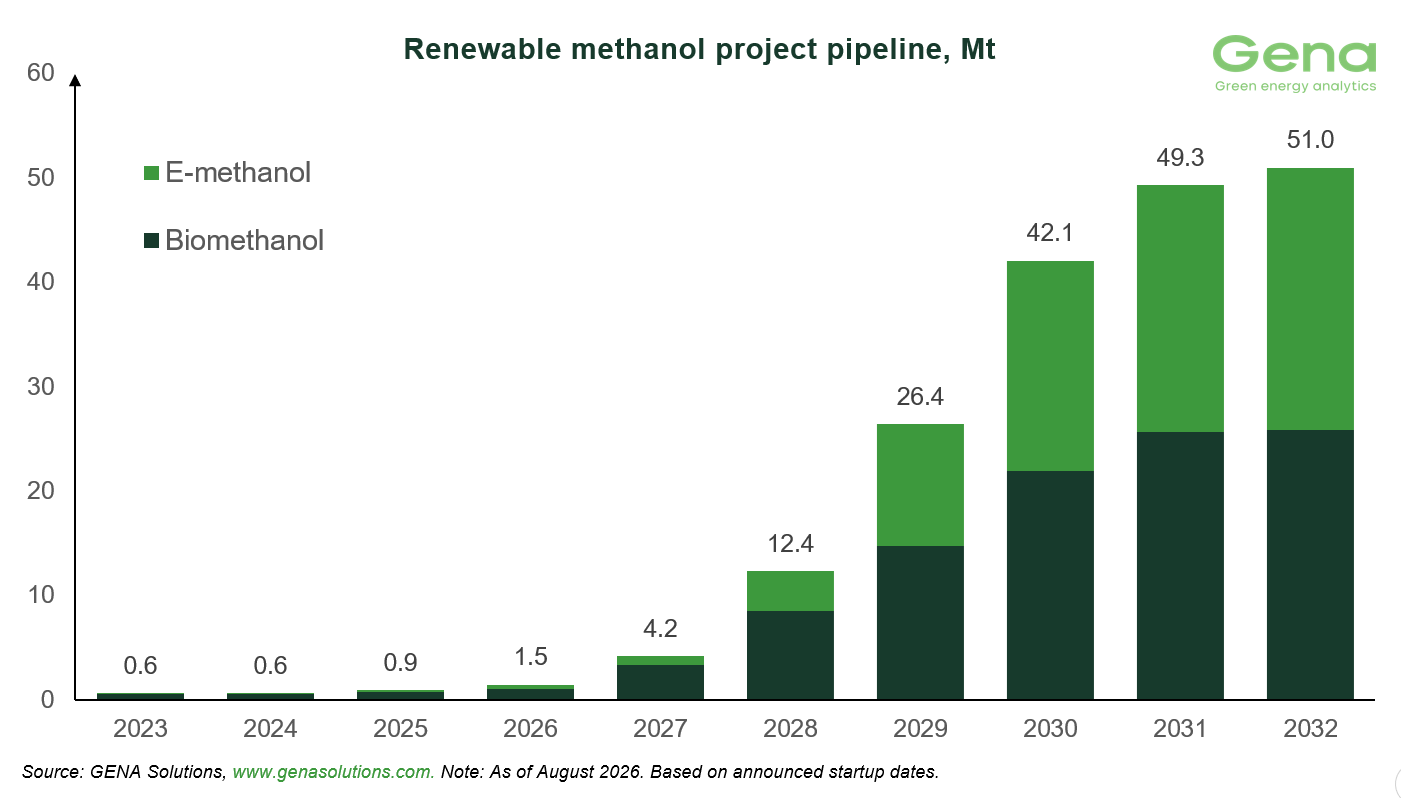
Renewable methanol project pipeline 4 Renewable methanol by feedstock 8 Renewable methanol by region 7 Project pipeline by status Methanol capacity scenarios


Photo credit: GENA Solutions
Published: 4 September, 2026

Continue Reading

Business

Singapore: MPA urges maritime firms to prepare for potential haze with plan

MPA encourages all maritime companies, especially those with workers performing outdoor work to maintain a business continuity plan for haze.
Admin

Published

on

By

RESIZED SG bunker tanker

The Maritime and Port Authority of Singapore (MPA) on Monday (31 August) issued Port Marine Circular No. 9 of 2026 on steps for maritime companies to take for potential haze affecting Singapore:

BUSINESS CONTINUITY PLAN FOR HAZE

This circular supersedes Port Marine Circular No. 09 of 2023.

With reference to the National Environment Agency’s (NEA) joint media release issued on 9 August 2026, hotspots were observed in parts of Sumatra and Kalimantan, with prevailing winds potentially bringing smoke haze towards Singapore. The dry conditions may further increase the likelihood of haze affecting Singapore. The Maritime and Port Authority of Singapore (MPA) encourages all maritime companies, especially those with workers performing outdoor work to maintain a business continuity plan for haze.

MPA advises all maritime companies to monitor the PSI level through the media and the NEA’s website (www.haze.gov.sg), keep at least a one-week supply of N95 masks for workers especially those who work outdoors, and observe the Ministry of Manpower’s (MOM) Haze guidelines and advisory for work which can be found on their website (www.mom.gov.sg/haze). The latter include guidelines to ensure that stocks of N95 masks are periodically inspected, remain serviceable, and not expired.

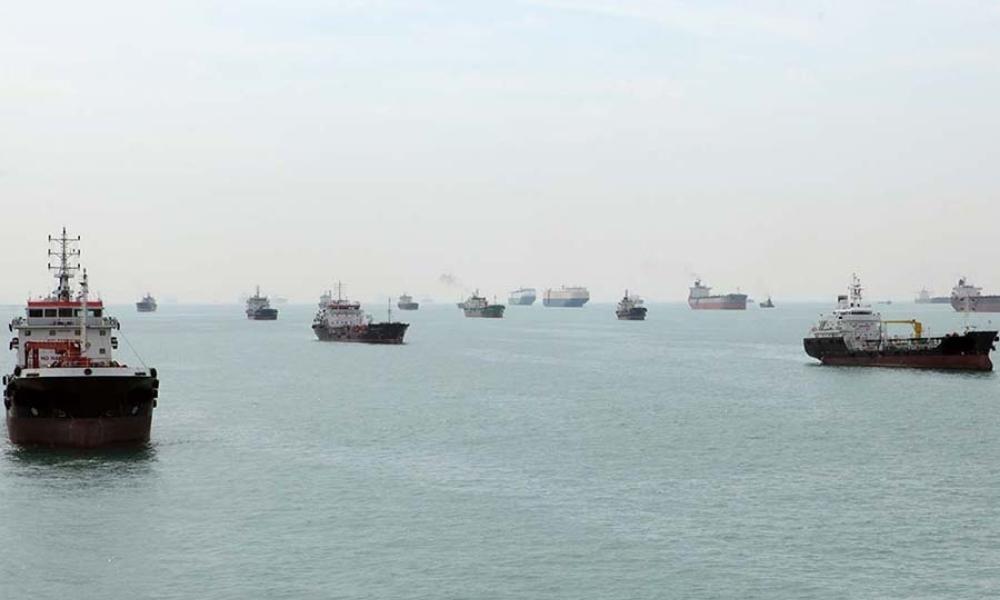
The visibility in the Singapore Strait and port waters could be significantly reduced in the event of haze. During periods of restricted visibility, shipmasters are advised to keep a proper lookout and navigate with caution. They are also advised to comply with the International Regulations for Preventing Collisions at Sea and in particular Rule No. 19, Rule No. 20 and Rule 35 concerning conduct of vessels in restricted visibility, exhibition of navigation lights and sound signals in restricted visibility, respectively.

In the interest of safety of navigation and life at sea, the Port Master may restrict the movement of harbour craft and pleasure craft in the port waters during reduced visibility conditions.


Photo credit: Manifold Times
Published: 31 August, 2026

Continue Reading

Alternative Fuels

DNV report: Regulatory uncertainty demands fleet strategies built for multiple futures

Report examines four regulatory scenarios, ranging from adoption of IMO NZF in its current form to its outright rejection, energy efficiency uptake, and long-term bunker fuel and technology strategies.
Admin

Published

on

By

DNV report: Regulatory uncertainty demands fleet strategies built for multiple futures

Regulatory uncertainty is increasing pressure on shipowners to make investment decisions that remain viable across multiple future scenarios, said classification society DNV on Thursday (27 August). 

According to DNV’s 10th Maritime Forecast to 2050, stronger global regulatory signals could accelerate the uptake of energy-efficiency measures, enabling the global fleet to consume up to 25% less energy by 2050 compared to a scenario where regulation is driven by regions.

The report examines four regulatory scenarios, ranging from adoption of the IMO Net-Zero Framework (NZF) in its current form to its outright rejection, which could lead to a period of prolonged regulatory gridlock, and explores the implications of these outcomes for fuel demand, energy efficiency uptake, and long-term fleet fuel and technology strategies.

Cristina Saenz de Santa Maria, CEO Maritime, DNV, said: “Ships ordered today will operate well beyond 2050, but many of the factors shaping their future performance remain uncertain. Regulatory requirements are advancing faster than the fuel, infrastructure, and technological systems needed to support them, making long-term investment decisions increasingly complex. The industry therefore needs greater clarity and alignment among all stakeholders to provide the confidence required for long-term investment. In the meantime, shipowners need strategies that deliver benefits today while remaining resilient across a range of regulatory and market outcomes.”

Energy efficiency is one of the most immediate and practical levers available to shipowners, delivering value across regulatory outcomes whether implemented at the newbuild stage or as a retrofit. A case study of a hydrodynamic measures retrofit on a 5,000 TEU container vessel showed potential annual fuel savings of 16%, with a payback time of around one to four years depending on future fuel prices. Retrofits can add similar value across many ship types and with sufficient planning can typically be completed during a standard class-renewal dry docking.

The development of the marine low-GHG fuel market remains a key challenge. While significant progress has been made in expanding alternative-fuel capabilities of vessels, scaling fuel production depends on confidence that demand will materialize. DNV projects shipping demand for low-GHG fuels to range from 4 to 22 Mtoe by 2030 and 33 to 185 Mtoe by 2050, depending on regulatory outcomes, with uptake also shaped by future uptake of shore power, plug-in hybridization, nuclear power, and onboard carbon capture systems.

Current project pipelines indicate a maximum global supply of 270 Mtoe by 2030, although actual volumes are likely to be lower due to project delays and other uncertainties, and shipping will need to compete with other industries for its share. However, the cost of reducing emissions varies significantly between fuel pathways, with abatement costs ranging from about 180 to 1,290 USD per tonne of CO₂ avoided, highlighting the importance of regulation and market incentives in enabling low-GHG fuel markets to develop.

Øyvind Sekkesæter, lead author of Maritime Forecast to 2050, said: “Scenarios explored in this year’s report show how different regulatory futures can lead to very different outcomes in energy efficiency uptake, fuel demand, and consequently, GHG emissions. By testing fuel and technology choices across multiple scenarios, shipowners can identify strategies that create value today while preserving flexibility as regulation, fuel availability, prices, and technologies evolve. Strategies that each owner chooses will also be dependent on their fleet type and operating context.”

Key findings from the report: 

  • Several regulatory futures remain possible as the IMO continues negotiations on the Net-Zero Framework, with these outcomes shaping investment decisions, low-GHG fuel uptake, and energy-efficiency deployment across the global fleet.
  • With global regulatory incentives in place, the world-fleet could consume 25% less energy by 2050 than under a scenario limited to regional regulations.
  • Energy efficiency can pay off regardless of regulatory outcome – 5,000 TEU container ship case study shows 16% annual fuel savings from hydrodynamic measures retrofit.
  • Shipping demand for low-GHG fuels could range from 4 to 22 Mtoe by 2030, and 33 to 185 Mtoe by 2050, depending on regulatory outcomes and the availability of these fuels in a competitive global market.
  • Current project pipelines indicate that a maximum of 270 Mtoe of supply could be available by 2030, though actual volumes are likely to be lower due to project delays and other uncertainties, and shipping will need to compete with other industries for its share.
  • Testing fuel and technology strategies across different scenarios can help shipowners identify robust choices for an uncertain transition. Testing, piloting, and verifying technologies can provide the trusted performance data needed to make investment decisions with greater confidence.

Note: DNV’s 10th Maritime Forecast to 2050 can be found here. 


Photo credit: DNV
Published: 28 August, 2026

Continue Reading
Advertisement

OUR INDUSTRY PARTNERS


Trending