
Analysis
Integr8 Fuels: Additional costs can make bunker buyers pay more
Taking additional costs together with calorific value, density short-lifts and overall fuel quality should yield a good benefit for the bunker buyer, writes Senior Research Analyst.

Anton Shamray, Senior Research Analyst at Integr8 Fuels, the bunker trading and brokerage arm of Navig8, on Thursday (20 August) published an analysis on the finer details regarding locational costs when purchasing marine fuel:
In the previous articles we looked into how bunker buyers unknowingly pay more for the fuel bought, either by buying fuel with a low energy content or by suffering losses due to density short-lifts. However, the total cost of fuel is also influenced by the additional charges and fees, which vary significantly by port and often between suppliers in the same port. Additional costs are generally known at the point of enquiry however these are sometimes overlooked when planning or buying bunkers, resulting in overpayments.
Additional fess can significantly add to stem cost
A sample of over 6,000 stems globally covering the first half of 2021 has been analysed of which over 30% were found to contain some sort of additional fee.

Figure 1. Additional fees broken down (source: Integr8 Fuels)
These fees typically include barging, port charges and dues, various taxes and surcharges, among others (Figure 1). On average, among the stems with additional fees the cost of the fuel itself contributes around 92% to the total stem value, however this varies dramatically by stem.
Knowing where additional costs can hit hard is critical to buying bunkers competitively, particularly when it comes to the barging fees as these on average represent over 5% being by far the largest contributor of all non-fuel related costs.
Depending on the port, barging fees are often charged on a tiered basis with the lumpsum charges for up to a certain quantity and a $/mt charge for the quantities above.
In a number of ports in Americas different suppliers charge different barging fees (example New York), which makes it even more difficult for a bunker buyer to calculate the true cost of bunkers and compare suppliers between themselves. The problem is compounded by additional fees and taxes that are often chargeable as a percentage of the total stem value.
Additional fees in the bunker industry ironically remind of the fee structure when ordering a takeaway delivery online.
To what otherwise looks like a cheap meal one needs to pay extra for a side, the platform then charges delivery and service fees, and because demand is high it gives an option to pay extra for prioritised delivery. In the end, what initially looked like a good value lunch becomes a relatively expensive meal overall.
Watch out for extra fees in North America, Med and Red Sea
Similarly, in the bunker industry additional fees can easily make what looks like a competitive price quoted by a supplier into a rather expensive quotation overall, particularly when quotes from different ports are compared.

Figure 2. Key ports by prevalence of additional cost stems and proportion of such costs in average stem value (source: Integr8 Fuels)
Figure 2 shows the share of stems with additional costs in the key global ports as well as the share of additional costs in the average stem value. This may vary depending on the data sample given that additional costs often include a single lumpsum element which is less felt for larger quantity stems, however the map shown should still be representative.
On Figure 2, the green circles are for ports where less than one in three stems come with additional fees. Yellow circles are for ports where between one and two in three stems have additional fees applied, while in red ports additional fees are charged on most occasions. The larger the circle the higher the proportion of additional fees in a stem hence the larger red circles are of the most interest. These can typically be found in North and Central America as well as around Mediterranean and Red seas. Although some green ports have rather large circles meaning a small proportion of stems have high additional fees, these are mostly due to the smaller sized stems which are invariably charged for barging, while their larger quantity counterparts are not.
While some ports have red circles, these can also be due to the addition of the non-barging fees. Port fees and agent costs can often be packaged with the fuel (example Lisbon) and almost as often be paid as part of voyage expenses (example Gibraltar). These costs, however, apply in any case and can hardly be avoided although running a fair comparison by either including (preferably for bunker only calls) or excluding them is nevertheless important.
Detailed costs calculations are key
Figure 3 shows an example of bunker planning between Houston and Panama. Please note this example may not always be representative and depends on the market conditions, however the main point is to show the importance of calculating the total bunkering cost, including barging and other fees and how these may influence the end result.

Figure 3. Houston vs Panama bunker intake planning
In the current market environment HSFO can often be found offered at competitive prices in Panama, often a few dollars below Houston, however assuming that both ports arepriced equally buying 1,000mt of HSFO turns to be more expensive in Panama, given the additional fee structure whereby the owner will overpay just under $3,000 for the stem. This calculation does not include any agency fees for Panama or out of port charges in Houston.
However, due to the structure of the fees, Panama will not always be the expensive port of the two. Figure 4 shows the sensitivity chart which illustrates that Panama is the cheaper port for quantities up to around 700mt and over 2,000mt.
While in this case the monetary difference may be relatively small, it can add up significantly over the course of a year or for a fleet of vessels.

Figure 4. Total paid difference between Houston and Panama on an HSFO stem (source: Integr8 Fuels)
The differences can also vary if bunkering is considered in ports with a different structure of additional fees or with no fees at all – this could be for a voyage whereby Suez is compared with Malta or a voyage where Piraeus is competing with Istanbul, among others.
Overall, additional costs including barging can significantly alter the economics of buying fuel from a supplier or a port and taking this into account, together with calorific value, density short-lifts and overall fuel quality should yield a good benefit for the bunker buyer.
Photo credit: Andrey Sharpilo on Unsplash
Published: 20 August, 2021
Bunker Fuel
Alkagesta highlights key insights on European choke point pressures in August
Update covers dual supply crisis currently shaping global bunker markets — a stalled Strait of Hormuz peace process and Rhine water levels at a 140-year record low — and the implications for Singapore.
Bunker Fuel
Integr8 Fuels: Why bunker markets could be lower than we thought
Marine fuel prices could prove lower than previously anticipated as easing refinery margins and improving bunker market fundamentals outweigh a still-uncertain crude oil outlook, says Integr8 Fuels.

By Steve Christy, Expert Contributor, Integr8 Fuels
29 July 2026
We have just seen one false dawn, is there another to come?
Last month, we wrote about how close we were to the expected lows in Brent and Rotterdam bunker prices, but not yet Singapore. Given what has happened since, a month is not only a long time in politics, but also a very long time in the bunker market.
There was a resumption of attacks in the Arabian Gulf region on 13 July, followed by targeted Houthi attacks on Saudi Arabia’s Red Sea oil infrastructure and shipping in the Bab el-Mandeb region, the gateway between the Red Sea and the Gulf of Aden. As a result, Brent futures fell to lows of around $70/bbl in late June and early July before surging to a high of $100/bbl on 23 July. Over the same period, Singapore VLSFO fell to $635/mt before climbing to $865/mt, a swing of $230/mt in just 16 days.
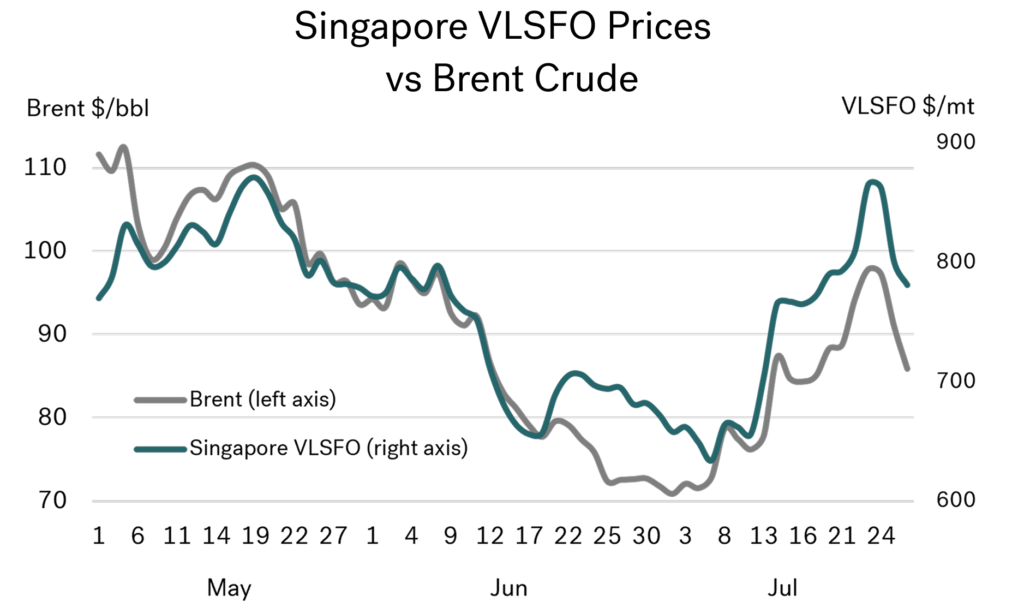
Prices at the start of this week fell sharply after a halt in Arabian Gulf attacks over the weekend, with front month Brent was down to intra-day lows of $84/bbl, and Singapore VLSFO $750/mt. However, at the time of writing there has been a ‘surprise’ attack by Iran, and retaliatory action by the US, with prices rising again. It looks like we could be at another false dawn.
The obvious questions are: will there be a return to peace negotiations, and are we close to the end of the war and free-flowing traffic through the strait of Hormuz (and also the Bab el-Mandeb)? The obvious answer is, we don’t know; there are only a few people that are likely to know the answer to this. All we can do is plan for every eventuality.
Low stocks, higher bunker prices, and a strong Singapore VLSFO premium: it’s a challenge
For those of us in the bunker market, the point we made last month about Singapore VLSFO trading at a strong premium to crude still holds, albeit slightly less pronounced. The loss of supplies through the Strait of Hormuz, together with the added uncertainty surrounding Saudi product exports from the Jizan and Rabigh refineries on the Red Sea, has sustained this premium.
These developments are likely to keep the Singapore VLSFO premium to crude at elevated levels until there is greater confidence that Middle East crude and product supplies are returning to more normal trading patterns. Amid all the price volatility, this Singapore VLSFO premium remains a key indicator to watch.
Backwardation in Brent futures illustrates market psychology
One month ago, backwardation in Brent futures (front month minus second month) had fallen from $7/bbl to virtually nothing, reflecting the market’s belief that an end to the war was little more than a negotiating step away. It wasn’t. The resumption of attacks, coupled with Houthi involvement in the Red Sea, sent prices sharply higher again, with backwardation in the Brent futures market returning to almost $6/bbl.
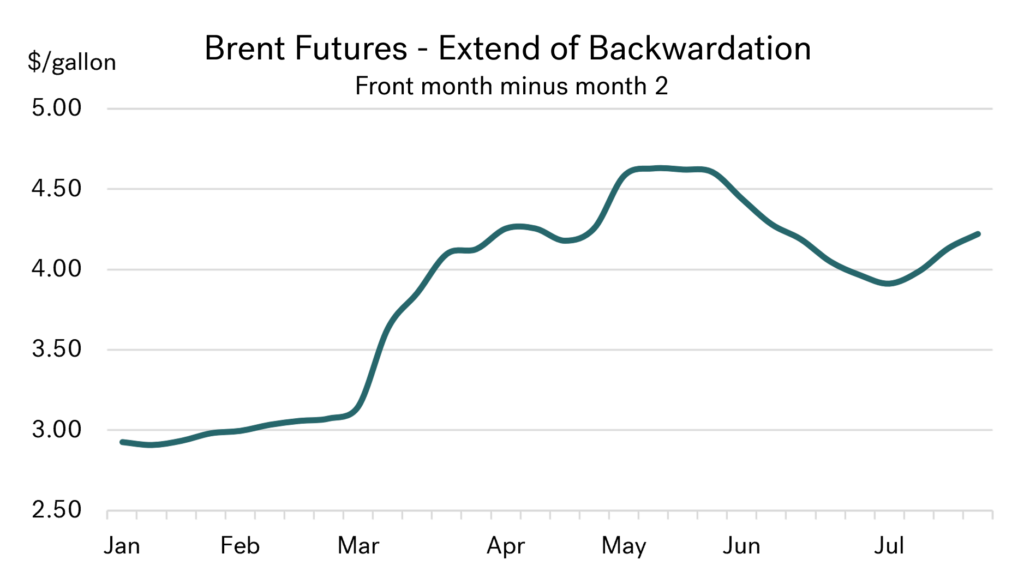
The halt in attacks over the past weekend has taken steam out of the market, with prices and backwardation falling sharply. Where we go from here depends if there is again a belief peace is on the horizon, or if this is another false dawn. The past month highlights how impossible it is to predict an ending to the war, and how fragile any expectations of peace can be.
We cannot ignore the price, but still must look to the future
It is impossible to write a report and not highlight the turmoil of the current market and what is happening. However, we still must look beyond this, to see where we could end up.
In an earlier report, we suggested the run-up to the US mid-term elections in November may be a backstop to the war. However, even this is not guaranteed. There are many dynamic elements to the economy and voter intentions, but one feature that will always crop up in the US is the gasoline price. This has risen from $3/gallon before the war to over $4/gallon for the past four months.
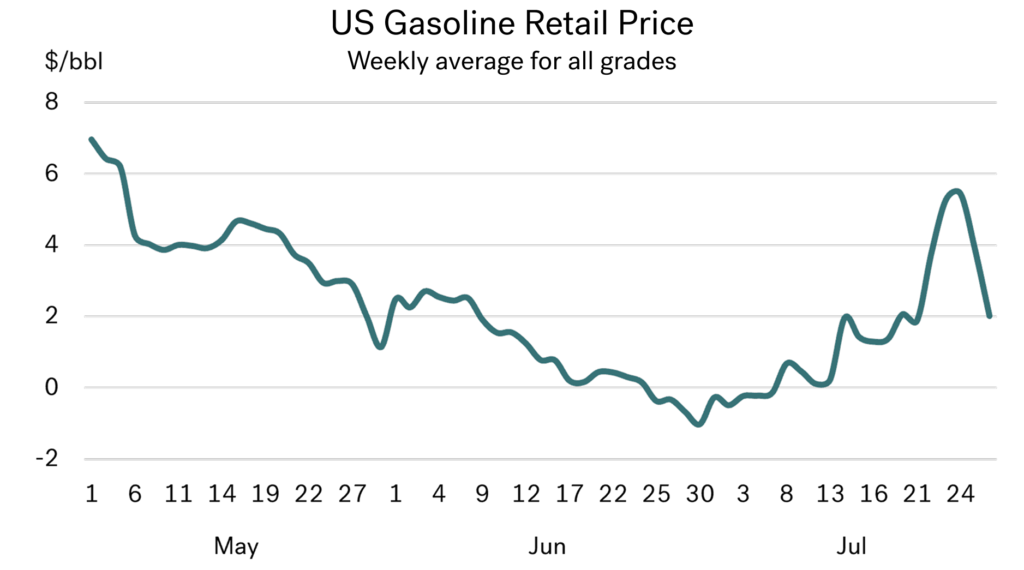
If it comes to it, will Republican voters want to see a resolution to the war and a return to $3 gasoline prices ahead of the elections?
We have a change of heart on how low bunker prices can go
We don’t know exact timings, but in any planning, we must look at what happens when the war does finally end and prices fall, whenever that may be. In past reports we have highlighted the view that Brent crude prices are unlikely to fall back to pre-war levels in the $60s, and Singapore VLSFO unlikely to go back in to the $400s. This may be the point at which these views change.
Previous thinking was based on a relatively short war, where there would be a large loss of oil supply and a massive stock-draw. In this case, tighter stock levels would be sufficient to keep prices higher than their pre-war levels once we returned to ‘normality’. This would mean Brent futures in the $70s (and not in the $60s), and Singapore VLSFO in the $500s, and not the $400s.
A number of mainstream analysts also held this view, although there were some that were lower and some higher.
Given the war has already gone on for much longer than almost everyone expected, this thinking must change. Yes, global stocks have been drawn down at a rapid rate, but this is slowing. Higher pricing and inflationary blows have had a major impact on global oil demand, with current indications that total oil demand in the second quarter of this year was some 4 million b/d lower than year earlier levels.
The graph below shows this sharp drop in demand and even if the war comes to an end relatively soon, and demand gets back towards some normality, a structural loss of more than 1 million b/d in global oil demand is still expected to have taken place because of the extended period of conflict.
If the war goes on for even longer, structural losses in global oil demand are likely to be even greater.

Source: US EIA
It’s a hard road, but we can get there
This means that once the war does end, market psychology will be looking at a rapid increase in oil supplies going into a global market which is much lower in demand. This opens the way for prices to easily return to their pre-war levels of Brent in the $60s and Singapore VLSFO in the $400s.
Now we just need those at the centre of negotiations to get us there.
Photo credit and source: Integr8 Fuels
Published: 30 July, 2026
Bunker Fuel Quality
FOBAS report warns of growing operational risks from ISO-compliant bunker fuels
LR’s latest FOBAS Fuel Quality Report reveals that the biggest fuel quality risks are no longer confined to off-specification fuels, with some compliant fuels creating operational challenges.

OUR INDUSTRY PARTNERS

MPA: 25 crew rescued after abandoning “MSC HERMES III” east of Vietnam

GCMD, Equinor to combine expertise on alternative bunker fuels, decarbonisation solutions

Wah Kwong NatPower, AREL partner on maritime electrification in Hong Kong

IMO technical seminar examines ammonia bunkering and infrastructure

Spring Marine to expand use of Sulnox Eco with four-year supply agreement

PortXchange: Rotterdam bunker volume shift offers warning as Spain adopts fuel law

ENGINE: East of Suez Fuel Availability Outlook (22 Sep 2026)

Singapore: Marine fuel testing firm CCIC Singapore faces winding up application

Peninsula confirms one fatality, crew member missing from bunker tanker “Hercules Star”

Singapore: MPA working with industry on next phase of digital bunkering, says Deputy CE

Amogy and LOTTE Fine Chemical to explore ammonia bunkering in South Korea

High Court of Singapore issues winding up order against Hengli Petrochemical International

Polaris Shipping orders WinGD engines capable of running on methanol, ethanol

APPEC 2026: Digitalisation in bunkering not merely a ‘paper-to-screen’ swap, states panellists
-
 Winding up1 week ago
Singapore: Marine fuel testing firm CCIC Singapore faces winding up application
-
 Incident2 weeks ago
Peninsula confirms one fatality, crew member missing from bunker tanker “Hercules Star”
-
 Technology2 weeks ago
Singapore: MPA working with industry on next phase of digital bunkering, says Deputy CE
-
 Ammonia2 weeks ago
Amogy and LOTTE Fine Chemical to explore ammonia bunkering in South Korea
-
 Winding up1 week ago
High Court of Singapore issues winding up order against Hengli Petrochemical International
-
 Engine2 weeks ago
Polaris Shipping orders WinGD engines capable of running on methanol, ethanol
-
 Technology1 week ago
APPEC 2026: Digitalisation in bunkering not merely a ‘paper-to-screen’ swap, states panellists
-

 Financial Result2 weeks ago
Singapore-based Uni-Fuels H1 2026 net income jumps 1,415% to USD 1.4 million